
Trace Properties Window
Traces define the colors and other characteristics used to display measurements. There are standard traces, measurement traces and quantity worksheet traces. The Trace Properties Window is used to edit the colors and characteristics for a trace. The Trace Properties Window can be invoked in the following ways:
- Pressing the Standard Trace List Window's "Add" or "Edit" buttons.
- Right-clicking in the list in the Standard Trace Tree Window and selecting "Add New Trace" or "Edit Trace".
- Pressing the Measurement Toolbar's "Edit Trace" button while adding a measurement or with a measurement selected.
- Pressing the Item Properties Window's Trace button.
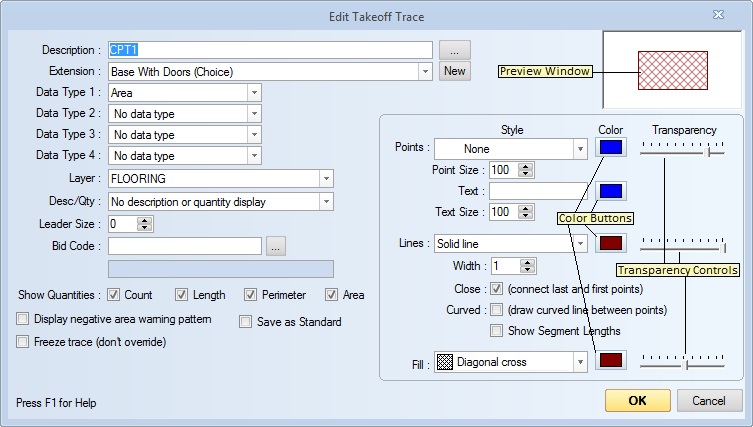
Figure 1: The Trace Properties Window
Description - The primary use of trace descriptions in when selecting standard traces from the Standard Trace List Window or the Trace Selection Window. Each standard trace must have a unique description.
When editing the trace for a measurement, this description is used to combine measurements in the Drawing Legend. To edit the description of the measurement itself, right-click on the measurement and select "Edit Description" from the Context Menu.
Standard Trace Selection Button - When editing traces other than standard traces, a "..." button will appear to the right of the description. You can press this button to select a standard trace from either the Standard Trace List Window or the Standard Trace Tree Window depending on the "Organize Traces in a Tree" setting in the "General" tab of the User Preferences Window. The colors and characteristics of the selected trace will be copied to the trace you're editing.
Extension - Select any of the Standard Extensions or "none" from the combo box. See Extensions Overview for more information on extensions. If an extension is selected, the quantity types can be set to any of the extension's fields.
New - If you press this button the Standard Extension Edit Dialog will be displayed to allow you to create a new extension for the trace. Only formula extensions can be created. Roll, Grid and Joist extensions can only be created from the Standard Extension List Window.
Data Type 1 - When a trace is applied to a measurement, the Data Type 1 defines the default dimension for the measurement (area, point count, length or perimeter). If you drag and drop the measurement from the drawing to another application, the default dimension is passed. So if a measurement had a default of "area", when you dragged and dropped the measurement to an Excel cell, the cell would be assigned the measurement's area.
If an Extension has been selected for the trace, any of the extension's fields may be used for the data type.
Data Type 2 - 4 - In some cases you may want to use several different quantities from the same measurement. For example, the area might determine the carpet required while the perimeter determines the base length.
In the trace, you can specify three additional data types (2-4) besides the first data type. These quantities can then be added as columns in the Measurement List.
Layer - Select the standard layer from the list. Layers allow you to show or hide selected measurements and annotations. For more information see the Standard Layer List Window.
Desc/Qty - Select one of the options for displaying the description and/or quantity for measurements using this trace. The options are:
- No description or quantity display
- Display description
- Display quantity
- Display both description and quantity
- Display detail number only
If you select the option "Include measurement detail number in description" in the "General tab of the User Preferences Window, the description and/or quantity will be prefixed with the measurement's detail number.
The "quantity" displayed will be based on the first Data Type selected above. By default, the description/quantity is displayed in the center of the first group of non-disconnected points. To move the description for a measurement; follow the procedures to Edit Measurement Description then move the edit window to the desired location.
Note: With Premier you can use the Special Extension Variable Name ReplDesc to override the description with custom text.
Leader Size - The "leader" is a line drawn from the displayed description to the measurement. This is the thickness of the line. If it is zero, no line will be drawn. By default the line is drawn to the first point in the measurement. But when a measurement is selected, you can right-click on a point and select that as the point to be drawn to.
Bid Code - You can enter a bid code manually or press the button to select a standard bid code from the Bid Code Lookup Window. If a standard bid code is selected, the bid code description will appear to the right of the button. Bid Code formatting and usage can be set up in the User Preferences.
Show Quantities - Traditionally, Dimension has always shown all the basic quantities (Count, Length, Perimeter and Area) in the quantity lists. With version 5.5 you can uncheck quantities you don't want to see. For example, if you were counting fixtures, the length, area and perimeter are meaningless and distracting. By default, all quanitites are checked.
Point Characteristics
Style - Select one of the symbols in the list to be displayed at each point of the measurement.
Point Symbol Color Button - Press this button to select the color to be used for the symbol.
Transparency Control - This slider controls the transparency of the symbol and text. Move it to the left for more transparency, to the right for less.
Point Size - Set the size of point symbols as a percentage. 100% makes them about the size of 10 point text on the drawing. Higher percentages make them larger, smaller percentages make them smaller.
Note: With Premier you can use the Special Extension Variable Names TracePointWidth, TracePointHeight and TracePointRadius to draw a fill colored rectangle or circle whose size matches the size of the object being counted.
Text - Enter any text that you want displayed near each point. If the text includes the percent sign (%), the point sequence number will be substituted for it. For example, if the text were "Pt%", then "Pt1", "Pt2", "Pt3", etc. would be displayed at the points.
Text Color Button - Press this button to select the color to be used for the text. This includes any text displayed at points plus the description and the leader line.
Text Size - Set the size of point text as a percentage. 100% makes the text about the size of 10 point text on the drawing. Higher percentages make it larger, smaller percentages make it smaller.
Line Characteristics
Style - Select one of the line styles in the list to be drawn between the points of the measurement
Color Button - Press this button to select the color to be used for the line
Transparency Control - This slider controls the transparency of the lines. Move it to the left for more transparency, to the right for less.
Width - Select the width of the line in pixels. Line widths only apply to solid lines
Note: With Premier you can use the Special Extension Variable Name TraceLineWidth to draw a fill colored line whose width matches the size of the object being measured.
Close - Check this box if you want the last point in a group to be connected to the first point in a group.
Curved - Check this box if you want lines between points to be curved. If this is checked, an arc Drawing User Preference "Default curved line degrees" will be used. During Advanced Point Editing you can drag the lines to the desired arc.
Show Segment Lengths - Check this box if you want the length of each segment of the line to be displayed.
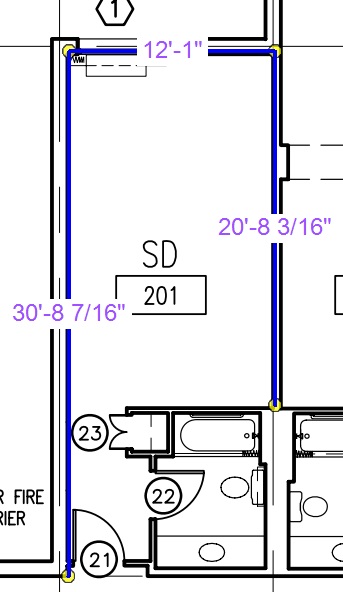
Measurement with segement lengths displayed
Fill Characteristics
Style - Select one of the patterns in the list to fill the area inside the points of the measurement.
Color Button - Press this button to select the color to be used for the fill pattern.
Transparency Control - This slider controls the transparency of the fill. Move it to the left for more transparency, to the right for less.
Display negative area warning - When a measurement's points are digitized in a counter-clockwise direction, the area within the points is calculated as a negative amount. This allows cutouts and other useful techniques. But it's possible to unintentionally create a negative area, especially for novice users. To avoid this problem, a distinctive pattern can be displayed for negative areas.
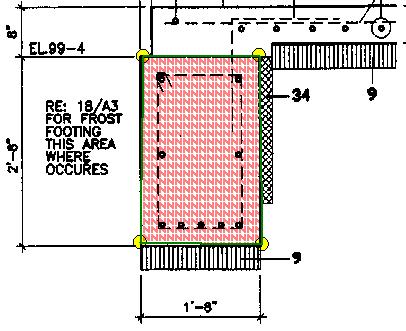
Figure 2: Measurement with negative warning pattern displayed
This pattern will only be displayed when ALL of the following conditions are met:
- The User Preference check box "Warn on negative areas" is checked.
- The trace's "Display negative area warning" checkbox is checked.
- The measurement doesn't have any disconnected points.
- The measurement points are digitized in a counter-clockwise direction.
This box will be checked by default if you select the "Area" data type or select a non-blank fill pattern. The box can be un-checked to eliminate the pattern for a particular measurement or for a standard trace.
Freezing a Trace
When a measurement is assigned to an item in the Quantity Worksheet, the trace of the item may be set to override the measurement's previous trace (See the Item Properties Window). To prevent this override, you can check the "Freeze Trace" check box shown in Figure 2. This checkbox only appears when editing the trace for a measurement.
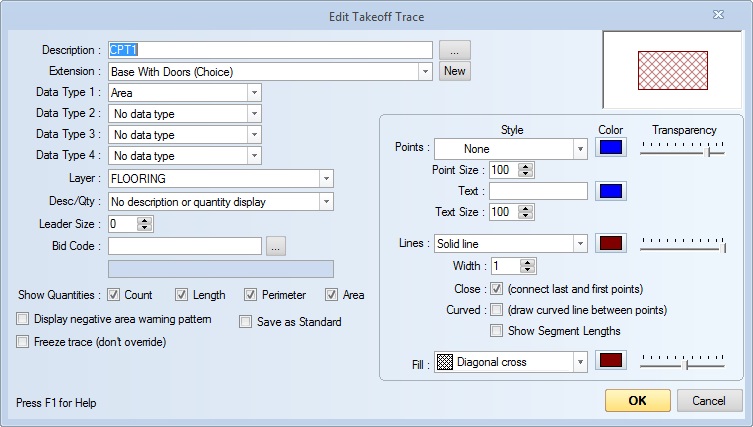
Figure 3: The Trace Properties Window with "Freeze Trace" checkbox
Save as Standard - This checkbox will be displayed left of the "OK" button when editing a measurement trace. If it is checked, the measurement trace will be saved as a standard trace. NOTE: If you organize traces in a tree, the new standard trace will be saved in the root folder of the tree.
Preview Window - The preview window shows what the trace will look like on a simple four point measurement. As you change the characteristics, the preview window will be instantly updated to show the resulting look.
WBS Values - Press this button to edit the WBS values for the trace. The Work Breakdown Values Window will be displayed.
OK - Press this button to finish defining the trace and save the trace properties.
Cancel - Press this button to cancel trace definition and discard all changes.