
Drawing Legend Overview
The Drawing Legend displays a grid of all traces used in a drawing. There are columns for the trace graphic, trace description, total quantity for all measurements using the trace and unit of measure.
The drawing legend can be displayed or hidden on a drawing-by-drawing basis. It can be displayed with an opaque or transparent background, with or without a border and/or grid lines. It can be placed anywhere on the drawing.
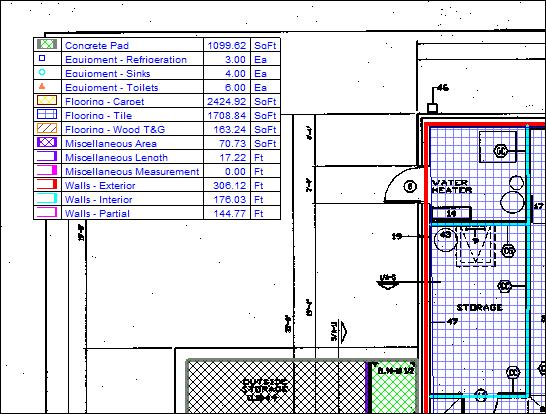
Figure 1: Drawing Legend with Opaque Background, Border and Grid
Displaying the Drawing Legend
For a new drawing, the drawing legend can be displayed by selecting the Drawing Legend Button on the Ribbon Bar View Tab.
Configuring the Look of the Drawing Legend
Once the legend is displayed, you can configure its look by right-clicking on the legend and selecting context menu options.
Transparent Background - If you select this option, the drawing as well as measurements and annotations will show through the legend. If you un-select this option the background will be an opaque white.
Always Readable - If you select this option, the legend will be displayed with a minimum font size of 8 points. This is useful to make the legend readable when printing large drawings to a smaller paper size.
Show Measurement Detail - If you select this option, each measurement will be shown in a separate row. If de-selected, measurements with the same trace description and trace data type will be summarized into a single row.
Show Quantity Column - If you select this option, columns will be added for the quantity and unit of measure. If de-selected, only the trace symbol and description columns will be displayed.
Show Decimal Places - If you select this option all quantities will be shown with two decimal places. If you only measure counts and don't want the decimal places, de-select this option.
No Border or Grid - If you select this option, the legend will have no border lines around the legend and no grid lines separating the rows and columns.
Border Only - If you select this option, the legend will have border lines around the legend but no grid lines separating the rows and columns.
Border and Grid - If you select this option, the legend will have border lines around the legend and grid lines separating the rows and columns.
New Drawing Legend - This menu entry display a sub-menu of options determining how the drawing legend will be configured and displayed for new drawings.
Positioning the Drawing Legend
When the legend is displayed, you can press the left mouse button down inside the legend, drag it to the desired location and release the mouse button.
Automatic Positioning for New Drawings
Any time the legend is displayed, you can define your preference for automatically displaying the legend on new drawings. Right-click in the legend, select "New Drawing Legend" from the context menu then select one of the options to display the legend in one of the drawing corners (or hide the legend). You can also set display defaults for new drawings (Transparency, Readability, Detail, Quantity column, Decimal places, Border and Grid).
Note: No legend will be displayed until measurements are added to the drawing.