
Project Quantity Comparison
Overview
Some contractors have numerous similar projects. In this situation, it may be useful to compare a recent project (the baseline project) to several earlier similar projects (the comparison projects). For example, a flooring contractor that does numerous projects for a restaurant chain might want to compare the flooring totals taken off for a new restaurant against quantities taken off for several earlier restaurants. This is what Project Quantity Comparison is for.
This functionality only provides a "ballpark" comparison. It just quickly points out significant differences in a graphical presentation. It is up to the user to determine if the differences are significant.
Summarizing Quantities
In most cases, it's not feasible to compare individual measurements. So instead we summarize measurements and compare the totals. Measurements can be summarized by measurement type (the Trace description) or by Bid Code. If you're using bid codes, that is usually the best way to go. Otherwise use trace descriptions.
If you intend to use trace descriptions, be careful not to change the descriptions to describe individual measurements. Each measurement has both a measurement description and a trace description. When editing a measurement trace, the description editing for intended for the measurement TYPE. To edit the measurement description, select "Edit Description..." from the Main Window Context Menu.
The summarized quantities are then adjusted for the project size. For example, if a comparison project is twice the size of the baseline project, its summarized quantities should be reduced by 50% for comparison. If the baseline project size is zero or the comparison project size is zero, no adjustment will be made.
Starting a Project Quantity Comparison
- Open the baseline project. It doesn't matter what drawing is displayed.
- Select "Project List" from the "View" tab of the Ribbon Bar or select "File/Project List Window..." from the Main Menu to display the Project List Window.
- We recommend you display the "Project Size" column in the window. That will allow you to see and edit the project sizes for the baseline and comparison projects.
- Select the comparison projects by clicking the selection check box in the first column.
- Press the "Do Selected..." button and select "Compare [Baseline Project Description] to Selected Projects..." from the menu.
- The Quantity Comparison Window will be displayed as shown in Figure 1.
Quantity Comparison Main Window
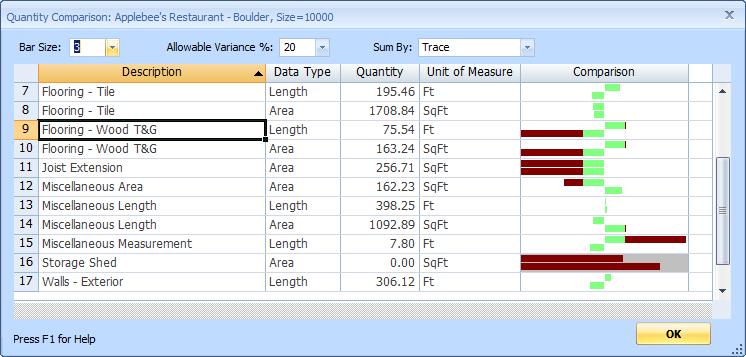
Figure 1: Quantity Comparison Main Window
Comparison List
Most of the window is filled with the list of summarized quantities. That list includes the following columns:
- Description - This is the summary description. It the row is summarized by trace description, this will be the trace description. If it's summarized by bid code, this will be the bid code (and description if available).
- Data Type - This will be the data type for the summary. If a measurement has multiple data types (as defined in the measurement trace), there will be a summary row for each data type.
- Quantity - This is the summarized quantity for the row from the baseline project.
- Unit of Measure - This is the unit of measure for the summarized quantity.
- Comparison - This is comparison graph for the row displaying the relative size of the comparison projects. This is described in detail below.
Comparison Graph
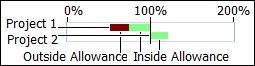
Figure 2: Comparison Graph - Existing Measurement
Figure 1 shows a typical comparison graph when the measurement type exists in the basline project. One bar is shown for each comparison project (labeled "Project 1" and "Project 2"). The center of the graph marks 100% of the baseline project. The quantity for Project 1 is less than the baseline project so the bar extends to the left. The quantity for Project 2 is greater than the baseline quantity so the bar extends to the right.
You can set an "Allowable Variance %" for the comparison (discussed below). The part of the bar that is inside the allowable variance is colored light green. The part that is outside is colored dark red.
If the comparison quantity was zero, the bar would extend all the way
to the left edge of the graph. If the comparison quantity was 200%
it would extend to the right edge. If the comparison quantity is
OVER 200%, the end of the bar would be bright red.
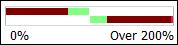
Figure 3: Comparison Graph - 0% and over 200%
If the baseline quantity is zero, the graph is displayed with a gray
background and dark red bars for all comparison quantities. Bar
lengths are in proportion to the maximum comparison quantity.
(The maximum bar will be the width of the cell.)
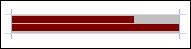
Figure 4: Comparison Graph - Zero Baseline Quantity
Other Controls
Bar Size: - This controls the height of the comparison graph bars. When the graph is initially displayed will default to three pixels high. They will be made higher if there is room without changing the height of the row. You can select a different bar height from the combo box control
Allowable Variance %: - This controls the percent of the bars to display in light green. You should set this to the variation you consider to be "OK". This helps to visually scan down the graph column and quickly identify variation outside the desired percentage.
Sum By: - This determines how the measurements are summarized. You can select from the following options:
- Trace - Measurements will be summarized by trace description
- Bid Code/Trace - Measurements with a bid code will be summarized by bid code. Those without bid codes will be summarized by trace description
- Bid Code Only - Measurements with a bid code will be summarized by bid code. Those without bid codes will be omitted from the comparison
OK - Press this button to close the window.
Quantity Comparison Detail Window
You can review the detail for a single row by double clicking on the row. The Quantity Comparison Detail Window will be displayed.
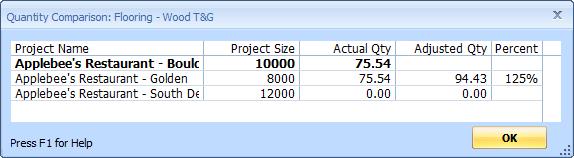
Figure 5: Comparison Graph - Existing Measurement
Most of the detail window is filled with the detail comparison list. The top row (in bold text) shows the baseline project. Then there is one row for each comparison project. The list has the following columns
- Project Name - The name of the project
- Project Size - The size of the project
- Actual Qty - The summarized quantity of the project
- Adjusted Qty - The summarized quantity of the comparison project adjusted by the ratio of the baseline project size to the comparison project size
- Percent - The percentage the adjusted quantity is of the summarized quantity for the baseline project. This will be blank if the baseline quantity is zero.
Press the "OK" button to close the detail window.