
Control Panel
Control Panels are vertical panels that can be displayed docked on the sides of the Main Window or floated above or beside the window. Different "Controls" can be placed in a panel to provide quick access to functions that are normally accessed via multiple mouse clicks. Those functions include:
- Bird's Eye Window - This provides the same functionality as the floating Bird's Eye Window but it is embedded in the control panel.
- Drawing List - This provides the same functionality as the Open/ Drawing List on the Home Ribbon Bar
- Drawing Tree - This provides the same functionality as the Open/Drawing Tree on the Home Ribbon Bar.
- Favorites - This allows you to save commonly used measurements, annotations and detail scales as "favorites". You can then quickly add them to other drawings and projects.
- Filtering - This allows you to filter the measurements selected or displayed based on who created them and/or on their work breakdown values.
- Layer List - This provides much of the functionality available in the Layer List Window but it only supports layer visibility changes. Layers can't be added, edited or deleted.
- Measurement Edit - This displays a quantity based on the last action taken for a new measurement. When a point is added (after the first point), the distance between the last two points is displayed. When an arc is created, the radius of the arc is displayed. The quantity can be changed and the points will be adjusted.
- Measurement Summary - This displays a list of all measurements on the current drawing page summarized by Trace description. Each summary line can be opened to show the measurement detail.
- Named Views - This displays a list of all named views for the project. Named views are created by zooming and scrolling to the desired view, pressing the "New" button in this control heading and entering the name for the view. You can return to a named view at any time by double-clicking the view in this control.
- Pattern Search - This displays a list of all the search patterns defined for the project and any incomplete searches for each pattern. You can review searches or invoke new searches using existing patterns.
- Quantity List - This control displays the quantities for the currently selected measurement. If no measurement or multiple measurements are selected this control will be blank.
- Rotation - This displays the rotation for the current page and allows that rotation to be changed.
- Trace List/Tree - This displays a list or tree of the standard traces. You can double-click a trace to assign it to the current measurement.
- Work Breakdown List - This lists the work breakdown values for the currently selected measurements.
- Worksheet Assignment Tree - This control is used to assign measurements (and annotations) to items in the Quantity Worksheet. It will be disabled in all versions except Premier.
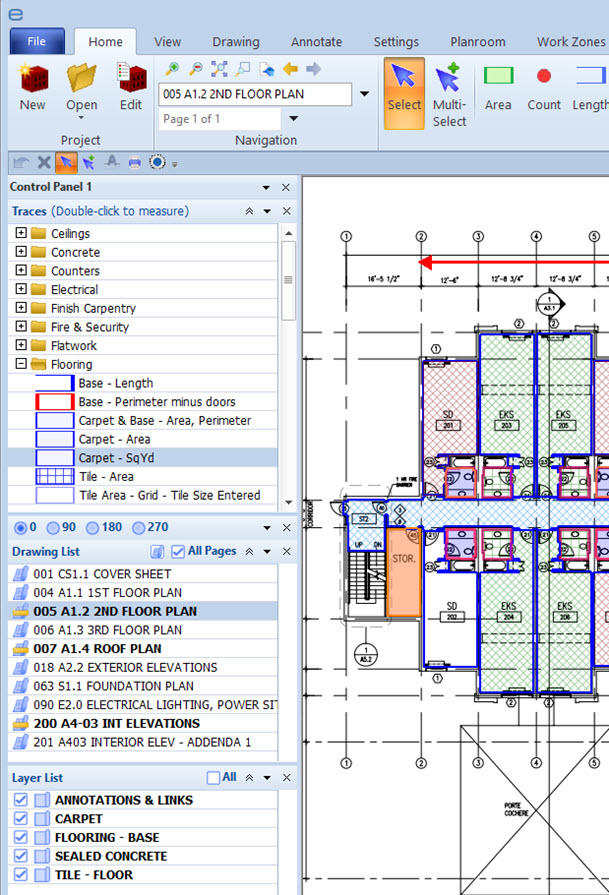
Figure 1: Control Panel with a few controls shown
Changing the Control Panel Display
The control panels can be displayed or hidden by selecting "View/Add Control Panel" from the Main Menu or the Ribbon Bar View Tab. You can display one or two control panels. By default the first panel is docked on the left of the main window and the second is docked on the right. But you can float or dock them as you wish. When a panel is hidden then re-displayed, the controls shown will be remembered.
The width of the control panel can be changed by right-clicking down and dragging the right edge of the panel.
At the top of the control panel is a heading that applies to the entire panel. Each control in the panel also has a heading. Each heading has buttons to control the display of controls in the panel:
 -
Add a control below the control containing the button pressed.
A context menu will be displayed listing the available controls.
Any controls currently displayed will be checked.
If you select a currently displayed control, it will be deleted
from its current position and inserted below the current control.
-
Add a control below the control containing the button pressed.
A context menu will be displayed listing the available controls.
Any controls currently displayed will be checked.
If you select a currently displayed control, it will be deleted
from its current position and inserted below the current control. -
Close the control containing the button pressed. If this
button is pressed for the top heading (the control panel heading)
you will be asked if you wish to close the entire control panel.
-
Close the control containing the button pressed. If this
button is pressed for the top heading (the control panel heading)
you will be asked if you wish to close the entire control panel. -
This button only appears on controls that can be minimized and maximized.
When a control is minimized, only the heading is displayed and a
maximize button is displayed in place of the minimize button.
Pressing the maximize button re-displays the full control.
Some controls have a fixed size and don't display a minimize
or maximize button.
-
This button only appears on controls that can be minimized and maximized.
When a control is minimized, only the heading is displayed and a
maximize button is displayed in place of the minimize button.
Pressing the maximize button re-displays the full control.
Some controls have a fixed size and don't display a minimize
or maximize button.
For controls that DON'T have a fixed size and aren't minimized, the height of the control can be changed by right-clicking down on the bottom edge of the control and dragging it to the desired height.
Operating Individual Controls
The Control Panel Heading Control

This control is used to close the entire control panel. The down-arrow
displays a menu to add controls at the top of the panel.
If the control panel is floating, the menu also has commands to dock
the control panel on the left or right. You can drag the panel and float
or dock it by dragging the heading. To dock the control panel, drag it until the
mouse cursor is on the left or right edge of the main window. As you're dragging,
a gray rectangle will indicate the docked position.
The Bird's Eye View Control
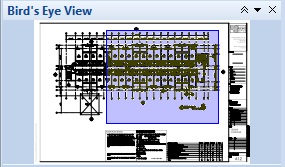
Figure 2: Bird's Eye View Control
This control displays a thumbnail image of the current drawing. The current view of the drawing is indicated by a blue rectangle with a light blue background. You can scroll the main window view by dragging the rectangle in the Bird's Eye control.
The Drawing List Control
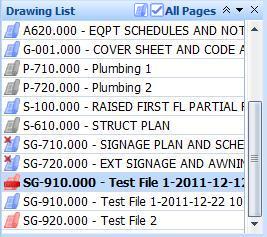
Figure 3: Drawing List Control
This control displays a list of all the drawings for the current project. You can double-click on a drawing to display it. You can also put the focus on the list, navigate with the up and down arrow keys and press the Enter key to display a drawing. The image on the left of each drawing indicates the status of the drawing as described for the Project Toolbar.
For drawings that are obsolete (see status images above), you can right-click on the drawing and select "Compare to latest version" from the context menu. A drawing comparison will be started automatically. The drawing selection process will be skipped to go directly to alignment. Drawings will be downloaded if needed. It may take a few seconds to prepare the drawings for comparison. This is only available if your license includes drawing comparison.
If the current drawing is a multi-page drawing, the pages will be displayed indented beneath the drawing name. If "All Pages" is checked, all pages will be displayed. If it is NOT checked, only pages with page descriptions will be displayed.
The button to the left of the "All Pages" checkbox allows you to hide drawings that don't have measurements. When unchecked it displays the drawing status icon for a drawing without measurements and all drawings are displayed. When checked it displays the icon for drawings with measurements and only drawings with measurements are displayed.
The Drawing Tree Control
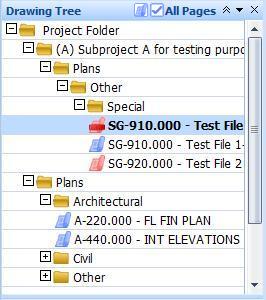
Figure 4: Drawing Tree Control
This control displays a tree of all the drawings for the current project. The tree reflects the subfolders containing the drawing files. You can double-click on a drawing to display it. You can also put the focus on the list, navigate with the up and down arrow keys and press the Enter key to display a drawing. When the focus is on a folder, you can press the space bar or Enter key to toggle the folder open/closed. The image on the left of each drawing indicates the status of the drawing. The drawings statuses and the tree hierarchy are explained in the Project Toolbar.
You can right-click on a folder in the tree and use the context menu option "Expand all branches" to open the folder and all its subfolders.
For batch printing, you can right-click on a folder in the tree and use the context menu option "Queue member drawings for batch print..." The Batch Print Drawing Selection Window will be displayed containing only the drawings from the subfolder.
For drawings that are obsolete (see status images above), you can right-click on the drawing and select "Compare to latest version" from the context menu. A drawing comparison will be started automatically. The drawing selection process will be skipped to go directly to alignment. Drawings will be downloaded if needed. It may take a few seconds to prepare the drawings for comparison. This is only available if your license includes drawing comparison.
If the current drawing is a multi-page drawing, the pages will be displayed indented beneath the drawing name. If "All Pages" is checked, all pages will be displayed. If it is NOT checked, only pages with page descriptions will be displayed.
The button to the left of the "All Pages" checkbox allows you to hide drawings that don't have measurements. When unchecked it displays the drawing status icon for a drawing without measurements and all drawings are displayed. When checked it displays the icon for drawings with measurements and only drawings with measurements are displayed.
The Favorites Control
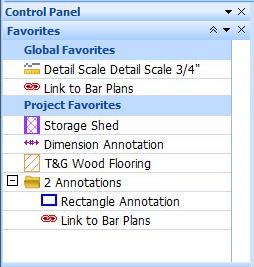
This control allows you to save measurements, annotations and detail scales as "favorites". You can then quickly reuse those objects by double-clicking on them or dragging and dropping them on a drawing. Each favorite is displayed with an icon and a description as shown above.
The control has two sections. The upper section is for global favorites. These are favorites that you wish to use across multiple projects. The lower section is for project-specific favorites. These are the favorites you only wish to use within the current project. When you switch from one project to another, the global section will be unchanged. The project-specific section will change to reflect the favorites for the current project.
When you first use the Favorites control, it will be empty as shown below.
![]()
The control is empty except for the "Project Favorites" row. This separates
the global favorites (above the row) from the project-specific favorites
(below the row).
To add measurements or annotations to the control, simply drag them from the drawing and drop them on the control. As you drag over the control, a dark line will appear to indicate where the favorite will be inserted. When the line is displayed in the desired position, release the mouse and it will be added.
You may have a set of measurements and/or annotations that you wish to re-use as a group. For example, you might frequently use a combination of a rectangle annotation and a text annotation. To add these, switch the drawing to multi-select mode, select the desired measurements and/or annotations then drag the entire group to the Favorites control. They will appear under a group row with a folder icon. (See the group row "2 Annotations" in figure 5 above.)
To add detail scales to the favorites, first open the drawing with the desired detail scale. Then select "Options/Set Detail Scales..." from the main menu. The Detail Scale List Window will be displayed. Drag the desired detail scale from the list and drop it on the favorites control.
You can organize the favorites within the control by dragging and dropping. You can move favorites from the generic section to the project-specific section or vice versa. Favorites cannot be moved from inside a group to outside a group. Moving a group favorite will move all group members.
You can right-click on a favorite to display a context menu with three options:
- Edit Description - Select this to change the description displayed for the favorite in the Favorites control. (It will NOT change the description of the underlying measurement, annotation or detail scale.)
- Delete Favorite - Select this to delete the favorite from the control. If you delete a group favorite, all the group members will be deleted.
- Assign to selected measurement(s) - Select this to overwrite an existing measurement(s) with the favorite trace.
Using Favorites via Drag and Drop - To add a favorite to the current drawing, simply drag it from the favorites control and drop it at the desired position on the drawing. The favorite will be added including all its points. That would be the measurement or annotation points. For detail scales it would mean the border points. You will see rubber banding to indicate the destination as you drag. When you drag and drop a group favorite, it drags and drops all the group members. When measurements are dragged and dropped, the points are adjusted for the scale and resolution of the drawing.
Using Favorites via Double-click - Sometimes you want to use a favorite without its associated points. To do this, simply double-click on the favorite. The action taken will depend on the favorite type:
- Detail Scales - When you double-click, the Detail Scale Edit Window will be displayed with the scale and description set to match the favorite. But the border is NOT set. Simply press the "Set Border" button to set the border points.
- Annotations - When you double-click on an annotation favorite, it's like starting a new annotation except the colors, text, line width, arrows, etc. are already set to match the favorite. All you need to do is click on the points.
- Measurements - When you double-click on a measurement, it starts a new measurement with the trace and description of the favorite. All you need to do is click on the points.
- Group Favorites - Double-clicking on a group favorite simply displays or hides the group members. It doesn't add them. (Use drag and drop for groups.)
Rotation and Scaling - When you add or use a favorite, it is adjusted for the rotation of the current view. This will usually produce the desired rotation. But no adjustment is made for scale or drawing resolution. Use Drawing Compare if you need to move or copy measurements with scale or resolution adjustment.
The Filtering Control
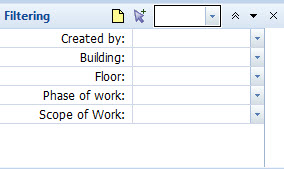
Filtering allows you to select or display measurements based on who created them or on their work breakdown values. You can use the "Created by:" drop down control to select the user. If you don't see any users, no one has set their user ID. Use the User ID Window to set your user ID.
You can use the work breakdown category drop-downs to select work breakdown values for filtering. (Advanced and Premier users only.)
With the user and/or work breakdowns chosen, you can press the multi-select button in the control heading to switch to multi-select mode and select all the measurements created by the selected user and/or having all the selected work breakdown values.
The heading also has a drop-down list to show or hide the measurements meeting the filters. If you select "Show", only measurements meeting the filters are shown. If you select "Hide", only measurments NOT meeting the filters are displayed. If you select "----", the filters do not affect the measurements displayed. Click on the yellow icon in the Filtering control section to clear all filters set in this control.
The Layer List Control
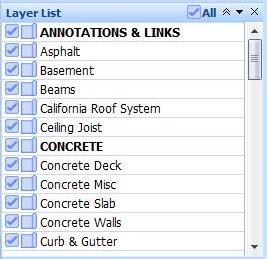
This control displays a list of the standard layers and their current visibility status. The visibility status is indicated by two symbols on the left side of each row. The first symbol indicates the default visibility setting for all drawings. It is one of the following:
 -
Show measurements and annotations assigned to this layer.
-
Show measurements and annotations assigned to this layer. -
Hide measurements and annotations assigned to this layer.
-
Hide measurements and annotations assigned to this layer.
The second symbol indicates the visibility setting for this specific drawing. It is one of the following:
 -
There is no specific setting for this drawing. The layer
visibility will be determined by the default setting (above).
-
There is no specific setting for this drawing. The layer
visibility will be determined by the default setting (above). -
Show measurements and annotations assigned to this layer in this drawing.
-
Show measurements and annotations assigned to this layer in this drawing. -
Hide measurements and annotations assigned to this layer in this drawing.
-
Hide measurements and annotations assigned to this layer in this drawing.
You can change the visibility for a layer by clicking on the buttons. You can change the visibility for ALL layers by holding down the Ctrl key while clicking on a button.
If the layer description is displayed in bold, that means there are measurements or annotations in the current drawing that are assigned to that layer.
If the "All" checkbox in the heading is checked, all layers will be included in the list. If this is NOT checked, only layers with measurements or annotations in the current drawing will be displayed.
The Measurement Edit Control
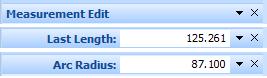
Figure 8: Measurement Edit Control
This control displays differently depending on the measuring step. When adding points or creating arcs, it displays an editable value. Otherwise it simply displays the control title "Measurement Edit" as shown in the first image in figure 5.
When adding points to a new measurement (other than the first point), it displays the distance from the next-to-last point to the last point (as shown in the second image in figure 5). The distance can then be changed and the last point will be moved accordingly.
When you create an arc from three points, the control will display the radius of the arc (as shown in the third image in figure 5). The radius can then be changed and the points will be adjusted. The first and last original points are not changed.
Note: Once you begin changing the distance or radius, the mouse is disabled until you complete the change by pressing the "Enter" key or cancel the change by pressing the "Escape" key.
The Measurement Summary Control
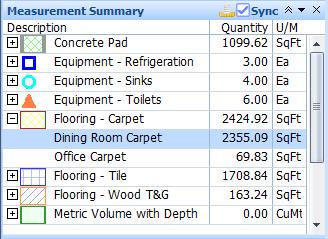
Figure 9: Measurement Summary Control
This displays a list of all measurements on the current drawing page summarized by Trace description. Each summary line can be opened to show the measurement detail.
The control heading has a button to open the full measurement list. It also has a "Sync" checkbox. If this is checked, the summary will be synchronized with the selected measurement list. When you select a measurement, all summaries are closed except the one containing the selected measurement. That summary is opened to show the detail and the selected measurement is shown with a blue background.
If you double-click on a summary row, that row will be opened if it is closed or closed if it is opened. If you double-click on a detail row the measurement will be selected and scrolled into view.
If you right-click on a detail row, a context menu will be displayed with an options to "Add points to measurement" and "Add DISCONNECTED points to measurement". If you choose one of these, the measurement will be selected (but NOT scrolled into view) and Add Points or Add Disconnected Point mode is selected. This is useful when you have an existing count measurement and find an additional item to be counted.
The Named View Control
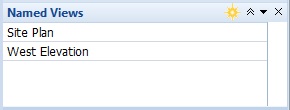
Named Views Control
This control displays any named views defined for the project. Named views are created by zooming and scrolling to the desired view, pressing the "New" button in this control heading and entering the name for the view. You can return to a named view at any time by double-clicking the view in this control.
You can right-click on a named view and perform any of the operations below
- Display the view in the main window
- Display the view in an existing extra drawing window
- Display the view in a new extra drawing window
- Delete the named view
The Pattern Search Control
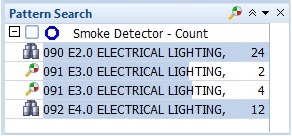
Figure 10: Pattern Search Control
This control displays any search patterns defined for the project. For each pattern it displays any searches that have not been completed. Incomplete searches can have one of several statuses:
 Waiting for search to begin.
 Search is in progress.
The dark background indicates the percentage complete.
Search is in progress.
The dark background indicates the percentage complete. The search is complete
but no pattern matches were found. You can right-click on the search and
select "Delete search" or right-click on the pattern and select
"Delete all searches with no matches".
The search is complete
but no pattern matches were found. You can right-click on the search and
select "Delete search" or right-click on the pattern and select
"Delete all searches with no matches". The search is ready for review.
Double-click it to start the review. The
Search Review Window will be displayed.
The search is ready for review.
Double-click it to start the review. The
Search Review Window will be displayed.
You can right-click on a pattern to show a context menu:
- Search current drawing for pattern - The current drawing area selection dialog will be displayed (see below).
- Search multiple drawings for pattern - The multiple drawing area selection dialog will be displayed (see below).
- Edit description - Edit the pattern description. By default the pattern description is the trace description but you can change it.
- Edit trace - Edit the properties of the pattern trace. This will NOT change the trace for previously completed searches.
- Select trace - Select the pattern trace from a list or tree of standard traces. This will NOT change the trace for previously completed searches.
- Edit search pattern - This will display the Search Pattern Edit Window to change properties of the search for subsequent searches.
- Delete searches with no matches - Will delete any searches for the pattern that had no matches.
- Delete pattern AND ALL SEARCHES - This will delete the pattern and all incomplete searches for the pattern. It will NOT delete previously completed searches.
You can search for multiple patterns on the current drawing or on multiple drawings. Check the boxes on the left side of the pattern. Then press the search button in the control heading. A context menu will be displayed with options to search the current drawing or multiple drawings.
If you select "Search Current Drawing for checked patterns", a window will be displayed to select the areas you want to search. The area list includes and defined search areas plus options to search the entire drawing or drag an area to search. The search icon on an area indicates that it has previously been searched for the pattern.
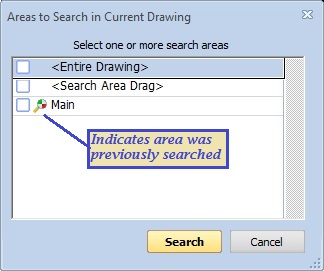
If you select "Search Multiple Drawings for checked patterns", a window will be displayed to select the areas you want to search. The area list includes and defined search areas plus options to search entire drawings. The search icon on an area indicates that it has previously been searched for the pattern.
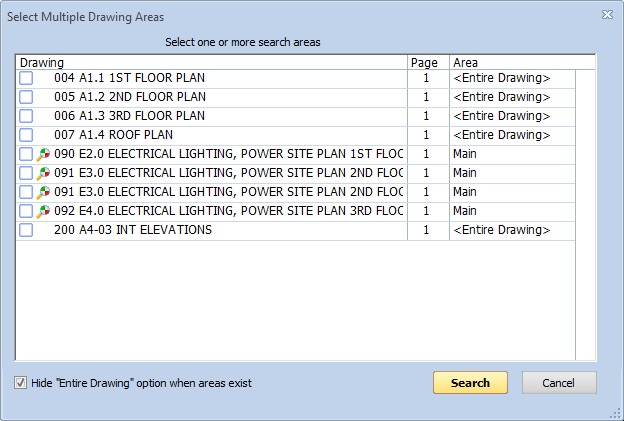
WARNING: Drawings can't be searched until their scale has been set. Drawings without scales will be excluded from the list.
The selected areas will be added to the search control and will be searched in the background.
The Quantity List Control
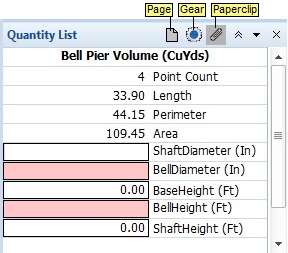
Figure 11: Quantity List Control
This control displays the quantities for the currently selected measurement. The name of the selected measurement is displayed at the top of the list. If no measurement or multiple measurements are selected this control will be blank. The default quantity for the measurement is highlighted.
Quantities in the list can be calculated or manually entered. Manually entered quantities have a black outline around the input area. Quantities that haven't been entered yet or can't be calculated yet are shown with a salmon-colored background.
Some variables have tool tips that explain the variable in detail. Tool tips are usually displayed when the mouse is paused over the variable. You can check the "page" button in the control heading to always display the tool tips. The page is gray when tool tips are only displayed on a pause. It is yellow when tool tips are always displayed.
You can drag quantities from the quantity list to other applications such as Excel. Click down on the variable name and drag. The control heading includes a "gear" button to change the type of information dragged. See the Measurement List for more information on copy/drag formats.
The control heading includes a "paper clip" button to display the Extension Help. If the quantity doesn't use an extension or if the extension doesn't have help, this button will be displayed with a gray background. If the help is already displayed, it will have a yellow background. If it is enabled (blue background), you can press it to display the help.
When a measurement using an extension is selected, the extension parameters can be edited directly in the quantity list. When an extension parameter has an Increment Key defined, a small button will appear to the right of the parameter name. Clicking on this button will increment the parameter. See the Standard Extension Field Properties Window for more information.
You can drag the separating line between the value and the description to change the column widths.
Quick Takeoff from the Quantity List Control
When entering numeric values in the quantity list, it's sometimes useful to copy a quantity from an existing measurement or dimension annotation; or to quickly digitize a few points and use the count, length, perimeter or area from those points.
To copy a quantity from an existing measurement or dimension annotation, right-click on the description for the numeric input variable and select "Get quantity from existing measurement" from the context menu. The numeric variable will display a blank yellow background to indicate a copy is in progress.
Then click on the desired measurement or dimension annotation. If you click on a point that could indicate one of several objects, a Measurement Selection Window will be displayed. Double-click on the desired object. If the object is a dimension annotation, the dimension length will be copied to the numeric input variable. If the object is a measurement, a menu of the measurement quantities will be displayed. Select the desired quantity and it will be copied to the numeric input variable.
To do a quick takeoff, right-click on the description for the numeric input variable and select "Quick takeoff" from the context menu. Then select "Point Count", "Length", "Perimeter" or "Area" from the sub-menu.
Then digitize the points for the quick takeoff measurement. As you do, the numeric input variable will be updated with the selected quantity for the measurement. While you're digitizing you can use the "Undo" button to undo points or the "Cancel" button to cancel the quick takeoff. When you finish digitizing, you can end the quick takeoff one of these ways:
- Press the "Enter" key
- Press the "S" key
- Press the "Select Measurement" button in the toolbar or ribbon bar
- Click back on the quantity list in the control panel
You can't change the drawing in the main window but you can display other drawings in an Extra Drawing Window and select a measurement or digitize the points in that window. The extra drawing window must be opened BEFORE you invoke Quick Takeoff.
The Rotation Control

This control displays the rotation angle for the current drawing. You can rotate the current page by clicking the rotation buttons.
If you hold down the Shift key while clicking a rotation button, All pages in the drawing will be rotated. If there are multiple pages in the drawing file, you will be asked "Override rotations for previously viewed pages?" If you select Yes, the rotation will be set for all pages. If you select No, only the current page and any pages not previous viewed will be rotated.
The Trace List/Tree Control
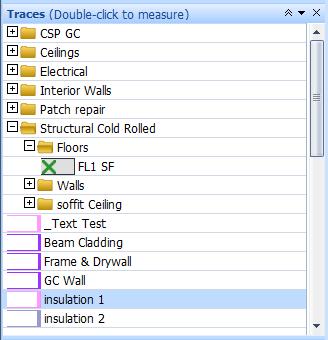
Figure 13: Trace List/Tree Control
This control displays a list or tree of the standard traces. You can double-click on a trace to assign it to the current measurement in the drawing window. The trace will also become the default trace for any new measurements. If you have selected the user preference to organize traces in a tree, the traces will be organized in a tree instead of a list. You can double-click on tree branches to open/close them.
New users often need to create many new traces to match their estimating system. If they have the names of those traces in an application such as Microsoft Word, they can easily create a new trace by dragging the description and dropping it one of the traces in this control. Initially the new trace will have the dropped description and all the properties of the trace the description was dropped on.
When the drop is made, a trace edit window is displayed to create the new trace. Either the Standard Trace Edit Window or the Easy Trace Edit Window will be displayed based on the setting based on the setting "Use Easy Trace Edit when description dropped for new trace" in the User Preferences "General" tab.
The Work Breakdown Control
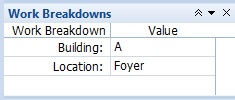
Figure 14 Work Breakdown Control
This control displays the work breakdown values for the currently selected measurements. It can also be used to edit the work breakdown values. There is one row for each work breakdown category in use for the current project.
When multiple measurements are selected with different values for a category, the value will display"<various>". You can edit the value for a single category without modifying the values for other categories. For example, you could select all the measurements in one room and set their location.
The Worksheet Assignment Control
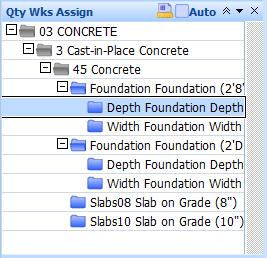
Figure 15 Worksheet Assignment Control
This control duplicates the functionality of the Item Assignment Toolbar. It is used to assign measurements (and annotations) to items in the Quantity Worksheet. Select an item in the tree to which you wish to assign measurements. Then press the One-time Assignment button to assign the selected measurement(s) to that item. Check the Auto-assign checkbox and all new measurements will be assigned to the item. This control will be disabled in all versions except Premier.
Floating and Docking the Control Panel
When the control panel is initially displayed, it is docked to the left side of the main window. You can undock it and float it or dock it on the other side. To float it, left-click down on the title (where it says "Control Panel"), drag it to the desired location, and release the mouse button. As you drag, you will see a rectangle indicating where the panel will be floated. To re-dock the panel, left-click down on the heading and drag it to the left or right edge of the main window. As you move the mouse cursor close to the side, you will see the drag rectangle snap to the docking location. Release the mouse.
When the control panel is floating, you can also dock it via docking commands in the heading's drop-down menu.